Overview
Current Version: 3.1.3
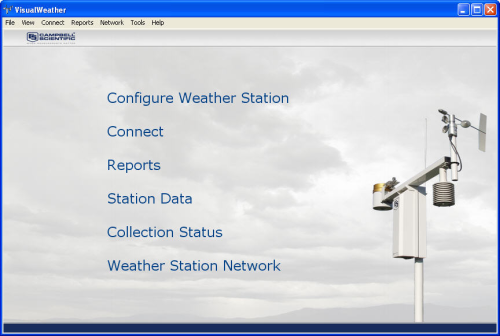
VisualWeather is support software for our weather stations. Version 3.0 or higher supports custom weather stations or the ET107, ET106, and MetData1 preconfigured weather stations. The software allows you to initialize the setup, interrogate the station, display data, and generate reports from one or more weather stations.
Read MoreBenefits and Features
- Requires no programming knowledge
- Takes just minutes to configure weather station
- Supports multiple weather stations
- Allows data to be collected manually or on a schedule
- Stand-alone software that does not require LoggerNet
Images

Technical Description
VisualWeather software is for customers who want reliable, real-time weather data and printed reports without worrying about technical details, such as programming or maintaining databases. It allows our pre-configured or custom Campbell Scientific stations to be set up in a few minutes. Multiple weather stations are supported.
VisualWeather's functionality includes program generation, communications, and report generation for preconfigured and custom weather stations. It uses a wizard to walk you through setting up the sensors for your weather station, configuring the communications link and data logger settings, and defining reports. Based on this setup information, VisualWeather generates the data logger program for the weather station (for preconfigured stations). You can also use Short Cut (included) for programming custom weather stations.
Communications
Communication protocols supported include direct connect, short haul modem, phone modem (including TAPI), RF, phone-to-RF, and TCP/IP. While connected to a weather station with VisualWeather, you can view measurements related to overall data logger health (battery voltage, internal temperature, error counters), current conditions for the weather station, and current measurement values for each of the sensors being measured, as well as data tables stored to memory (for table-based data loggers). Data can be collected for VisualWeather's report database either manually or on a schedule.
Report Generation
Report generation offers a variety of preconfigured reports for preset or custom intervals based on what sensors are being measured. It also offers a number of calculated values, such as evapotranspiration, Growing Degree Days, etc. The reports are displayed on the screen, and the user can print them or save them as an image file. Data can also be exported to an ASCII file for further analysis (for those familiar with Campbell Scientific's data formats, it is TOACI1, which is a comma-delimited data file with heading information). Batch processing of reports is available to automate report generation.
System Requirements
- Requires a serial port on the PC or a USB-to-serial port adapter
- TCP/IP and Telephony services must be installed and enabled on the PC (refer to manual for more information)
License for Use
This software is protected by United States copyright law and international copyright treaty provisions. Installation of this software constitutes an agreement to abide by the provisions of its licensing agreement. The agreement grants the user a non-exclusive license to use the software in accordance with the following:
- The purchase of this software allows you to install and use a single instance of the software on one physical computer or one virtual machine only.
- This software cannot be loaded on a network server for the purposes of distribution or for access to the software by multiple operators. If the software can be used from any computer other than the computer on which it is installed, you must license a copy of the software for each additional computer from which the software may be accessed.
- If this copy of the software is an upgrade from a previous version, you must possess a valid license for the earlier version of software. You may continue to use the earlier copy of software only if the upgrade copy and earlier version are installed and used on the same computer. The earlier version of software may not be installed and used on a separate computer or transferred to another party.
- This software package is licensed as a single product. Its component parts may not be separated for use on more than one computer.
- You may make one (1) backup copy of this software onto media similar to the original distribution, to protect your investment in the software in case of damage or loss. This backup copy can be used only to replace an unusable copy of the original installation media.
This software may not be sold, included, or redistributed in any other software or altered in any way without prior written permission from Campbell Scientific. All copyright notices and labeling must be left intact.
Compatibility
Please note: The following shows notable compatibility information. It is not a comprehensive list of all compatible products.
Dataloggers
| Product | Compatible | Note |
|---|---|---|
| 21X (retired) | ||
| CR10 (retired) | ||
| CR1000 (retired) | ||
| CR1000X (retired) | ||
| CR10X (retired) | ||
| CR200X (retired) | ||
| CR211X (retired) | ||
| CR216X (retired) | ||
| CR23X (retired) | ||
| CR300 (retired) | ||
| CR3000 (retired) | ||
| CR310 | ||
| CR350 | ||
| CR500 (retired) | ||
| CR5000 (retired) | ||
| CR510 (retired) | ||
| CR6 | ||
| CR800 (retired) | ||
| CR800 (retired) | ||
| CR850 (retired) | ||
| CR850 (retired) | ||
| CR850 (retired) | ||
| CR850 (retired) | ||
| CR9000 (retired) | ||
| CR9000X (retired) |
Additional Compatibility Information
Weather Stations Supported
Visual Weather supports ET107, Toro T107, ET106, MetData1, or custom Campbell Scientific stations. Support for custom weather stations was added in version 2 (released September 2005), and support for the ET107 and Toro T107 was added in version 3.0 (released April 2009).
Specifications
| Current Version | 3.1.3 |
| Operating System | Windows 7 (32 and 64 bit), Vista, or XP |
Related Documents
Product Brochures
Manuals
Downloads
VisualWeather Patch v.3.1.3 (45.7 MB) 03-08-2012
Upgrade Visual Weather version 3.x to 3.1.3.
This patch requires that version 3.x exists on the computer.
VisualWeather Patch v.2.3 (26.3 MB) 19-12-2008
Upgrade Visual Weather version 2.0, 2.1 or 2.2 to 2.3.
This patch requires that version 2.0, 2.1 or 2.2 exists on the computer.
VisualWeather Trial v.3.1.3 (56.1 MB) 03-08-2012
A fully functional 30 day trial version of VisualWeather.
VisualWeather is for those who want reliable, real-time weather data and printed reports without worrying about technical details.
Related FAQs
Number of FAQs related to VISUALWEATHER: 35
Expand AllCollapse All
-
If the computer’s hard drive is filling up, check the C:\\Campbellsci\\VisualWeather\\sys\\bin\\ogs folder. This folder contains the communication logs created by VisualWeather, which can grow quickly. All of the files in this folder can be deleted. To delete the files, it may be necessary to stop VisualWeather temporarily to prevent some files from remaining open.
If the VisualWeather Reports folder (typically C:\\Campbellsci\\VisualWeather\\Reports) is filling up with old reports, delete any reports that do not need to be saved.
To prevent automatic report creation, follow these steps:
- On the main VisualWeather screen, click the Reports menu and select Batch Reports….
- The Batch Report Schedule window will open. The batches listed here can be either manually run or run on a schedule. Batch reports are often used to add additional reports to a website generated by VisualWeather.
- The far right column of the table is labeled Next Report Time.
- If there is a time stamp in the cell of this column, then the report is being run automatically.
- If Manually Generated is displayed in the column cell, then the batch is only run when the Run button is clicked.
- For each listed batch report that is automatically run, select the report by clicking it.
- Click the Edit… button.
- The Batch Report Selection window will open. In the middle on the bottom, there is an area labeled Output As. These are the output options for the batch reports.
- The batch reports that have the Web option checked are transmitted to the designated website.
- The batch reports with the .bmp or .jpg boxes checked are created in the VisualWeather Reports folder. To prevent the batch from creating these reports when it is run, clear the .bmp and .jpg checkboxes.
- Click the Save Batch button.
If all the .bmp and .jpg checkboxes are cleared, no reports should be saved in the VisualWeather Reports folder unless a batch is manually run.
-
Make sure that the station is set up to collect data automatically:
- From the main VisualWeather screen, select the Collection Status link, and verify that automatic collection is set up.
- Verify that the Pause Scheduled Data Collection for All Stations box is not checked.
If data collection needs to be set up, edit the station using the Weather Station Network link on the main VisualWeather screen.
-
Add reports by following these steps:
- On the main VisualWeather screen, click the Reports menu and select Batch Reports….
- On the Batch Reports Schedule screen, click the New… button.
- On the Batch Report Selection screen, select a weather station.
- Select a Report Type option.
- Select the Generate According To Schedule option.
- In the Interval field, set an interval, such as 1 hour.
- On the right side of the screen, checkboxes are selected based on what data is available from the station. Select or clear reports by checking the boxes.
- In the Output As: section, check the Web box.
- Click the Create Batch button.
- Enter a name for the batch.
When the batch runs, files are created in the web folder, transferred automatically via FTP to the website, and added automatically to the web page. They are listed as additional options on the drop-down report that is displayed after clicking the weather station name in the top left corner.
-
For all versions of VisualWeather, the version information is displayed during startup. As an alternative, version information can be viewed through VisualWeather Help:
- On the main VisualWeather screen, click the Help menu and select About (VisualWeather versions 2.2, 2.3) or About VisualWeather (VisualWeather version 3).
- On the About screen, the version and build information are displayed.
- For version details about the VisualWeather components, click the Versions button.
-
This is a bug caused by the Delphi development tools used to create VisualWeather. Campbell Scientific released a patch (VisualWeather 3.1.3) that added a control to turn off tool tips (Tools | Options | Show Hints) to work around this bug. To view and download software patches for VisualWeather, go to the Downloads section of the Support tab on the VisualWeather product page.
-
VisualWeather was tested on Windows XP, Vista, and 7. To date, there have been no reports of customers experiencing problems using VisualWeather on Windows 7 (64-bit).
To test whether VisualWeather will work in a particular Windows environment, download the 30 day trial version in the Downloads section of the Support tab on the VisualWeather product page.
-
Typically, Campbell Scientific software is not developed for, or extensively tested on, Windows Server computers. Because Windows Server installations are all uniquely configured, it is nearly impossible for our application engineers to replicate a customer’s implementation environment at our facility. Consequently, the support provided is limited.
To test whether VisualWeather will work in a particular Windows Server environment, download the 30 day trial version in the Downloads section of the Support tab on the VisualWeather product page.
-
No, but this feature has been enabled with the release of the VisualWeather 3.1.3 patch. To view and download software patches for VisualWeather, go to the Downloads section of the Support tab on the VisualWeather product page.
-
There are three steps for transferring data from a weather station to the Web:
- Collect the data from the weather station.
- Format the data into reports and screens.
- Move the formatted screens and reports to a location that can be accessed using the Internet, such as a website.
Step 1 (collecting the data) is accomplished when the station is created in VisualWeather. The last screen in the setup process is the Scheduled Collection screen. There is a checkbox for enabling scheduled collection and a place to indicate the scheduled collection interval. If the box is checked and the VisualWeather program is running, once every interval the software will access the station, collect the data, and store it in the VisualWeather database.
Step 2 (formatting the data) is done automatically. When data is collected, the Passive Monitoring screen is automatically updated with the new values. If batch reports are generated on a schedule, those are also done automatically.
Step 3 (moving the formatted data) is a little more complicated because several elements are required. The first needed element is a place–a location on a web server–where files can be put for later access via the Internet. This requires two things:
- There must be a location–disk space on a server–where the VisualWeather program can send the report and screen files. The server will be the host for the files. When Internet users browse to the website’s URL address and request the files, the server will provide them.
- There must be an account on the server. VisualWeather sends files to a server using FTP (File Transfer Protocol), which requires that the program have an account with permission to put files on that server. The FTP process requires:
- the URL (the address) of the server where the space is
- the user ID of an account that has FTP access to the website (often this can be anonymous)
- the password for the account
- the FTP protocol that VisualWeather should use to transfer the files via FTP
- the destination folder (or the remote folder) on the server where the VisualWeather files will be stored
After obtaining a location on the server to put the website files and an account on the server to transfer the files via FTP, the next step is to set up the remote location and the VisualWeather program so that they can operate automatically.
Setting up the remote location requires the transfer of some files via FTP from VisualWeather to the remote location. This process only needs to be done once. The VisualWeather Help describes it this way: “Note: In order to set up the web page, the user will initially need to copy default.htm and the working directory\\Web\\yui directory to the FTP location. These will not be copied automatically.”
For example, if the working directory on a computer is C:\\Campbellsci\\VisualWeather\\, the files that need to be sent to the remote site (the “yui” folder and the “default.htm” file) are stored at C:\\Campbellsci\\VisualWeather\\Web\\.
The yui directory contains all of the javascripting called by the default.htm file used to set up the page on the website and to handle the page features (such as menus and tabbing). Note: It may be helpful to rename the default.htm file to index.htm on the website so that it loads automatically when visitors browse the site.
After the default.htm file and yui folder are copied to the website, the javascripting contained in them will automatically handle the display and formatting each time the data is collected.
The final step is to get the web output enabled and the FTP process going. This can be done using the Web Output Options screen:
- On the main VisualWeather screen, click the Tools menu and select Web Output Options….
- Check the Web Output Enabled box. This will cause VisualWeather to create the components for use in the website screens, such as chart and report images.
- Do not change the default location listed in the Local Output Folder field.
- Under Output Images Of, select Station Data Screens.
- On the lower half of the screen, check the FTP Enabled box. Fill in the address of the website and the ID and password needed to transfer the data from the local output folder to the website via FTP.
- Click the OK button.
- When exiting the Web Output Options screen, there will be a message indicating that the window needs to remain active for the transfer to work.
- Do not close the VisualWeather and data screen; however, they can be minimized.
-
More information can be found by following these steps:
- On the main VisualWeather screen, click the Tools menu and select Web Output Options….
- Click the Help button at the bottom of the screen.
- The “Web Output Options” entry in VisualWeather Help will be displayed.