


On August 1, 2007, the I-35W St. Anthony Falls Bridge over the Mississippi River in Minneapolis, Minnesota, collapsed in the middle of rush hour. What followed was a tremendously cooperative effort to quickly and safely replace the bridge. It harnessed today’s technologies and continues to provide insight into bridge performance and long-term health to show how internal instrumentation on the piers can be used to increase quality assurance, monitor construction loads, and show traffic and wind-load effects on long-term pier performance.
This first part of a larger program involving the entire bridge pertained to only the Southbound Pier 2 columns and foundations. There, two types of strain gauges and thermometers were installed to monitor three phases of the bridge and foundation system: (1) internal concrete curing temperature of the foundation elements, (2) construction loads, and (3) long-term health.
Four levels of six strain gauges each were installed in two 100-ft-deep foundation shafts (48 gauges total). Gauge levels were designed to identify load-carrying contributions from various soil layers.
Each gauge level consisted of four vibrating-wire strain gauges positioned at quarter points around the circumference of the shaft cross section. Two of the four vibrating-wire gauges at each level were coupled with a resistive strain gauge situated at opposite sides of the shaft. This scheme provided long-term stability with the slower vibrating-wire gauges along with fast measurements from the resistive gauges during dynamic events.
In addition to the foundation measurements, two levels of four vibrating-wire strain gauges were installed in the two columns supporting the two southbound concrete box girders (16 total vibrating-wire gauges). Mid-level gauges were duplicated with resistive strain gauges for measuring short-duration transient events.
Two separate data acquisition systems were used to measure the vibrating-wire and resistive strain gauges. The vibrating-wire gauges (including the internal thermistors) were read with a Campbell Scientific AVW200 and recorded with a CR1000 data logger. The resistive gauges were measured with Campbell Scientific’s CR9000 high-speed data-acquisition system. Both systems were self-powered with solar panels and deep-cycle batteries, and each system uploaded data to a remote host server via cellular modem. This arrangement allowed the data-acquisition systems to operate independently of on-site construction power and communications, and they did not interfere with day-to-day construction activities. Key aspects to both data-acquisition systems were remote data monitoring, remote program downloading, and remote reconfiguration as the data-acquisition requirements increased and decreased.
Phase 1 involved internal concrete temperature monitoring. The embedded thermistors internal to the vibrating-wire strain gauges provided one means of assuring that concrete temperatures stayed within acceptable ranges. The first figure below shows the internal shaft temperature at each of the gauge levels over the course of shaft and footing construction.
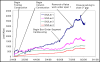
Phase 2 monitored increasing loads and how those loads were distributed down the length of the shafts as construction progressed. The figure below shows the load on one of the shafts beneath the Pier 2 footing, along with construction milestones. This figure shows that almost 800 kips of the 3500-kip total shaft load was resisted in end bearing, and that about half the remaining load was carried by the rock-layer side shear. Load steps are evident between May 29 and July 9, showing the placement of each of the 15 box-girder segments.
Phase 3 is ongoing. It uses the calibrations and correlations derived during Phase 2 to monitor the long-term health of the bridge. Variations in shaft and column loads can identify aberrant conditions, and alert officials to take appropriate actions. Just prior to the opening of the bridge, truckload tests were conducted with eight 50-kip trucks (400-kip total) located at various locations along the bridge deck. (See photo on first page.)
This project was well-suited to demonstrate the benefits of the spectral analysis method for reading vibrating-wire sensors. Not only did this project involve a large number of vibrating-wire sensors, but the setup was located 5 ft from a 1000-kW generator. Even with the large generator nearby, no data was lost due to noise, and no extra analysis was needed to determine if measurements had been compromised by noise. In fact, the raw data were posted automatically to a publicly available website every 15 minutes, without review or qualification. Because of the success of the new method in this project, the program manager already has plans to make it a part of two future bridge-monitoring projects.
Case Study Summary
Application
Monitoring of bridge construction and performanceLocation
Minneapolis, MinnesotaProducts Used
AVW200 CR9000 CR1000Contributors
University of South FloridaParticipating Organizations
Minnesota Department of TransportationMeasured Parameters
Construction, traffic, and wind loads; internal concrete temperatureView the PDF