Making Real-Time Crest Measurements
by Mike Nelson | Updated: 09/08/2020 | Comments: 0
Blog Topics
Area / Application


Product Category


Corporate / News
Search the Blog
Subscribe to the Blog
Get an email when a new article is posted. Choose the topics that interest you most.
Suggest an Article
Is there a topic you would like to learn more about? Let us know.
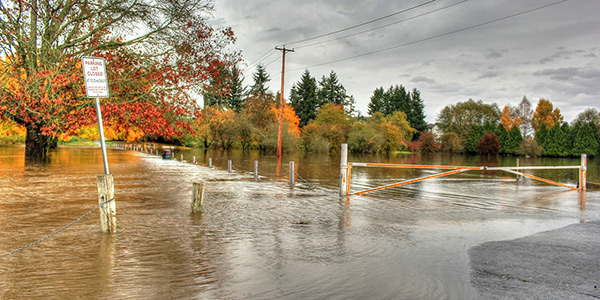
There are times during major weather events when we may hear the news reporter indicate the local river is expected to crest in the next 12 hours at an estimated stage level.
What is a crest and a stage level, and how do they affect me?
Basically, the crest is the expected or measured high water level before the water begins to recede at a specific location for a specific event. The event may be a heavy rainstorm, a hurricane, or a spring snow melt that causes high water levels in the local streams, rivers, or other bodies of water. Typically, the location is specified based on where the high water has the most potential to cause damage or threaten life.
Stage is a term for water level based on a fixed local reference point or datum and at a fixed position on the body of water. The reference point is surveyed to obtain a precise elevation and normally correlated to the mean sea level.
Based on years of monitoring and analyzing the data for each gauging site, reasonable predictions can be made related to forecasting how much water will be flowing in a river, what stage levels are safe, and at what stage levels flooding will occur. Monitoring these sites has been ongoing for decades and in several cases, more than 100 years.
Today—with the use of field-grade, automated data acquisition systems—the stage measurement is usually made every 15 minutes. This 15-minute stage data gives great insight into the dynamics of the body of water being monitored. However, during an event, the actual crest will often occur between two 15-minute collection points, and measurements of the actual crest is missed due to not sampling fast enough.
To capture the crest, often a manual gauge is used in addition to the automated system. This is a solid tube mounted securely to a bridge pier or other solid structure. Holes in the bottom of the tube with vent holes at the top allow water to come into the tube at the same level as the main body of water. A graduated staff rod is secured inside the tube and rests on a datum pin, which helps to ensure the staff rod is always at the same elevation. A cork material is carefully placed in the tube, and the cork material floats on the top of the water. The cork sticks to the staff rod at the surface of the water, and as the water recedes, the cork indicates the crest measurement. This method identifies the crest level, but it does not give the time or date the crest was detected, and it only catches the highest event between site visits.
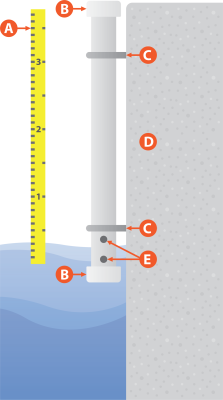
B: Pipe cap
C: Bracket
D: Secure mounting structure
E: Holes to admit water
As technologies develop and evolve, measurements that once were only available manually can now be automated. Campbell Scientific’s LevelVue™B10 is one water-level sensor that now can automatically measure the crest stage reading.
The LevelVue B10 water-level sensor is based on an indirect pressure measurement to determine water levels. This technology is often referred to as a bubbler. Bubbler-type water-level sensors are widely used, as they provide stable data and do not need a stilling well for the installation. Typically, bubblers are used to measure the water levels at the 15-minute rate, but the LevelVue B10 has the ability to also measure and report the crest stage reading detected between the 15-minute primary measurements.
In the image below, the 15-minute data is highlighted at each end with the dots showing the actual water level between the 15-minute marks. In this case, a peak of 1.79 m (5.87 ft) was detected and can be saved for later processing or used for immediate action, such as signaling an alarm condition. Note: Only the detected peak value between primary measurements is saved.
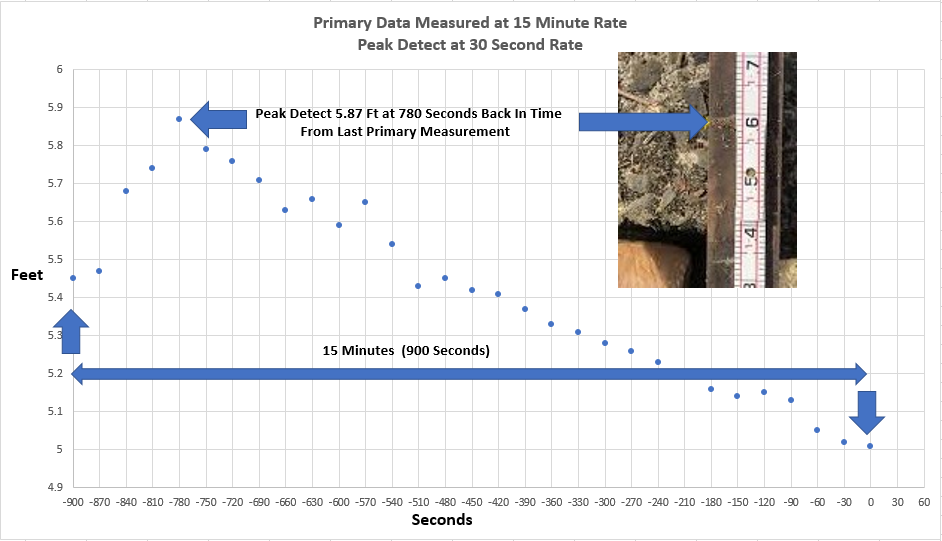
Click the graph for a larger image.
Often, the crest gauge is located a few feet to several feet upstream or downstream from the automated gauge. Based on the slope of the river, this distance can cause a difference in the reading of the two gauges that must be noted. With the LevelVue B10, measuring both the main stage data value and the crest at the exact same location eliminates that difference.
Although the LevelVue B10 is not intended to eliminate the crest-stage gauge, it does provide valuable information on what the actual crest was and when it occurred. This data can be used in real time to generate alarms, send random transmissions on the GOES system, or simply just be logged for future reference.
For more information about this product, visit the LevelVue B10 web page.


About the Author
 Mike Nelson was a Market Sales Specialist in the Environmental Group at Campbell Scientific, Inc. He has more than 30 years’ experience as an electrical engineer designing hardware and software products for the water monitoring industry. An extraordinary amount of Mike’s time while engineering was spent working directly in the field with the customers, which greatly influenced his designs and the teams he managed. Mike enjoys spending his free time out of doors.
Comments
Please log in or register to comment.