Get the Most out of VSPECT™
by Jacqalyn Maughan | Updated: 08/22/2023 | Comments: 3
Blog Topics
Area / Application


Product Category


Corporate / News
Search the Blog
Subscribe to the Blog
Get an email when a new article is posted. Choose the topics that interest you most.
Suggest an Article
Is there a topic you would like to learn more about? Let us know.
Understanding the benefits of VSPECT™ will help ensure you are maximizing your benefits when using this technology. In this article, we’ll explore this topic to provide you with a better measurement experience.
Why do Campbell Scientific monitoring platforms give me extra vibrating wire data?
Have you ever used our VSPECT monitoring platforms (CR6, CRVW3, AVW200, VWAnalyzer, or Granite™ VWire 305)? When you were using these to measure a vibrating wire sensor, you may have thought, Why do they give me six data points instead of two like everybody else? You’re in luck! Together, we’ll walk through each type of data point and talk about what VSPECT can tell you about your sensors.
If you haven’t used these products, this article will help you understand the benefits of VSPECT so you can make an informed decision when considering using our products and technology.
Thermistor Resistance and Sensor Frequency
First, we’re going to look at the thermistor resistance and sensor frequency. These are two data points that every data acquisition system will give you.
When it comes to the thermistor resistance, it can be converted into temperature and used as a data point or to correct for temperature variation in the vibrating wire sensor.
Now let’s look at the most important data point: the sensor frequency. This can be converted into engineering units (pressure, strain, load, etc.) to measure changes to the sensor’s environment.
Our VSPECT-enabled monitoring platforms don’t just read the frequency. VSPECT takes the sensor frequency and separates it from competing frequencies in the sensor signal, resulting in the most accurate measurement. Using VSPECT will ensure that you are getting the most repeatable data possible. We can do this by removing electrical interference from sources such as power lines, nearby heavy machinery, or hydroelectric power generation.
Sensor Amplitude
What is the sensor amplitude? This is a measure of the root-mean-squared millivolt response of the vibrating wire sensor (that is the strength of the sensor response). If you record this data point over the life of the sensor, it can provide a high-level overview of its relative health.
An example would be if you notice your frequency data is erratic and you know there is no possible way for the environment to be changing that much. You plot your sensor amplitude data from the day you placed your sensor to today and notice that the amplitude has decreased dramatically. This tells you that something is affecting the sensor’s signal strength and that further investigation may be necessary.
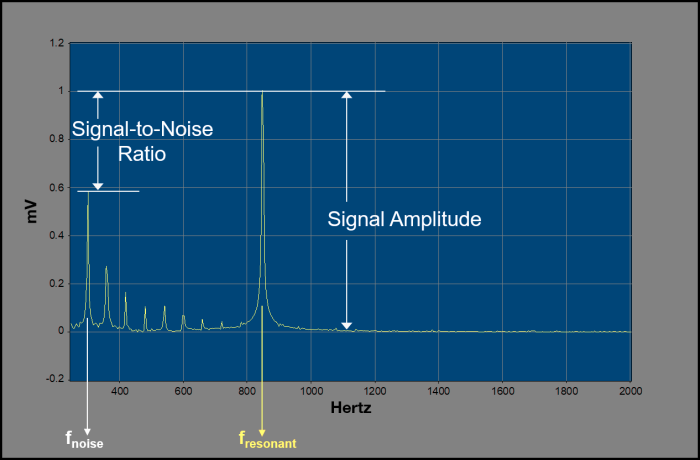
Noise Frequency and Signal-to-Noise Ratio
You may be familiar with noise frequency, which is the amplitude of the highest electrical noise frequency—also known as interference—that is contributing to the sensor signal being read by the monitoring platform. This could be 60 Hz interference from power lines, nearby mining equipment, or hydroelectric power generation. It could also come from harmonics that are produced at integer multiples of the sensor’s frequency. If you store this data, it can help you identify the source of interference that is affecting your sensor measurement.
Now let’s look at the signal-to-noise ratio, which is a ratio of the sensor frequency to the noise frequency. This tells you how much the electrical noise around your sensor is affecting your measurement. Higher numbers indicate that the noise has less impact on the sensor’s signal, and small numbers indicate a greater impact. Since VSPECT separates and eliminates interference, even substantial interference won’t affect the measurement. But other manufacturers’ monitoring platforms may see an effect on their accuracy.
Decay Ratio
The decay ratio is the “ring down” of a vibrating wire sensor, which VSPECT measures. Plotting the decay ratio over time allows you to see any changes to the sensor environment or sensor characteristics since its installation. This is another metric to show the health of your sensor.
A Big Caveat
We have an important thing to remember when discussing this topic. We don’t have numbers or thresholds for what is considered “healthy” for any sensors. It depends on the manufacturer and type of vibrating wire sensor. Every manufacturer is different. This means we can’t give exact sensor amplitude, signal-to-noise ratio, or decay ratio that tells you if your sensors are functioning properly. Don’t worry, though. We will give you the data that helps you validate your sensors so you can feel confident of your results.
Get the Most out of VSPECT
When we talk to customers about our VSPECT-enabled monitoring platforms (CR6, CRVW3, AVW200, VWAnalyzer, and VWire 305), they often don’t realize they are already getting data that is used to verify the health of their sensors!
At Campbell Scientific, we provide the tools to be successful in any project, and we pride ourselves in being a part of long-term projects that can withstand the test of time.
Credits: Michael Adams, Eric Schmidt, and Josh Brown of Campbell Scientific, Inc., contributed to this article.
If you have any questions, please connect with us by leaving a comment below or contacting the support and implementation team (CSI-Infrastructure@campbellsci.com) or the sales team (infra-sales-na@campbellsci.com).


About the Author
 Jacqalyn Maughan is the Marketing Specialist in the Infrastructure Group at Campbell Scientific, Inc. She received her bachelor's degree in Public Relations with a minor in Multimedia Development. Away from work she enjoys spending time with her family and two feline children, reading, and learning new things.
Comments
Saadi Al-Musawi | 08/24/2023 at 08:37 AM
Interesting article.
Thank you.
Dr. Saadi Al-Musawi
Jacqalyn Maughan | 08/24/2023 at 05:56 PM
Thank you, Dr. Saadi Al-Musawi.
Hicker | 01/14/2024 at 04:42 PM
It's quite amazing, I am looking for more articles like this.
Please log in or register to comment.